
Why the 2026 World Cup Had So Many Goals
More matches explain much of the record total, but not the higher scoring rate. See what uneven matchups, attacking patterns and long shots contributed.
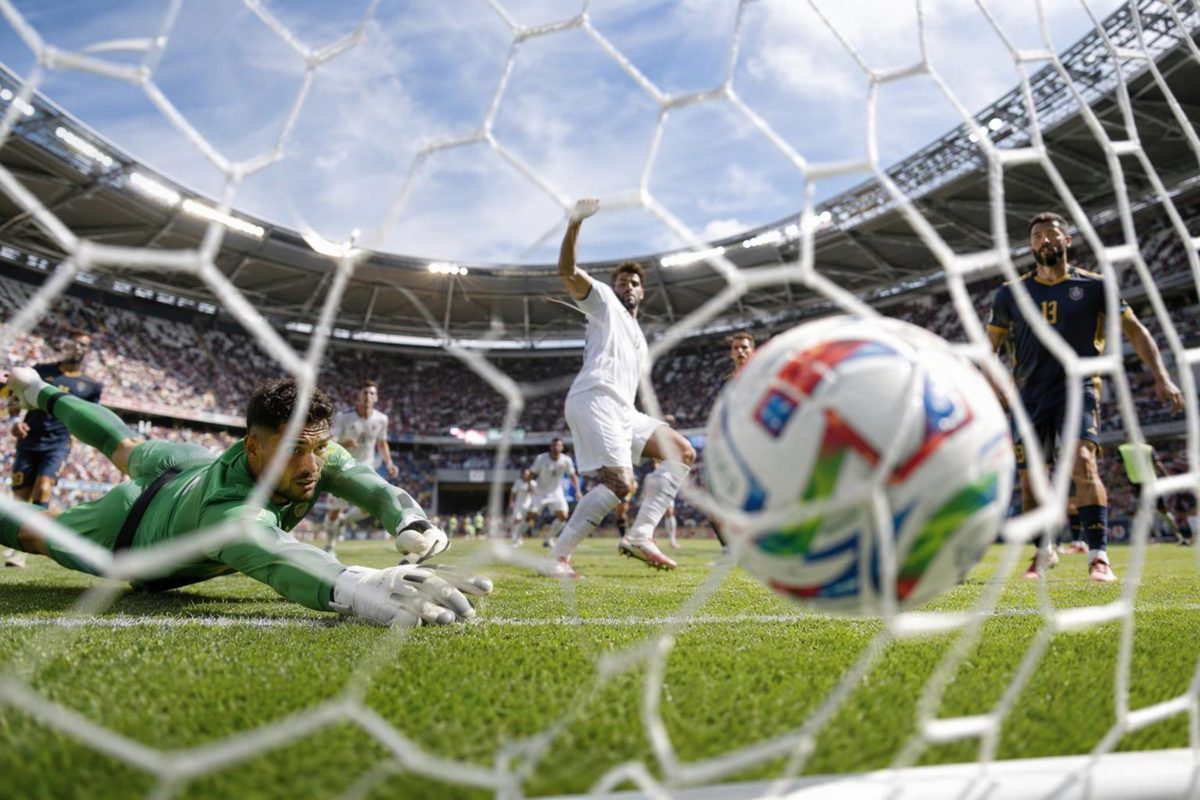
The 2026 men’s World Cup was high scoring in two different senses: it produced a record 308 goals, and its 2.96 goals per match was the highest average since 1970. FIFA’s tournament review establishes those final figures.
Expansion explains much of the record total. The higher rate needs a different explanation: analyses suggest uneven matchups, stronger attacking combinations from the best teams, and weaker teams doing more than simply defending. Long-range goals also contributed more than in 2022. These are plausible explanations, not a measured breakdown of each cause’s contribution.
More games explain the total—not the whole story
Goals per match means all match goals divided by matches played, combining both teams’ scores. It includes extra-time goals, but not penalty-shootout conversions. It is not an individual team’s scoring average.
| Tournament | Goals | Matches | Goals per match |
|---|---|---|---|
| Qatar 2022 | 172 | 64 | 2.69 |
| Canada, Mexico and USA 2026 | 308 | 104 | 2.96 |
The 2022 total and 64-match format are recorded in AP’s tournament report; the final 2026 figures and both averages appear in FIFA’s review.
A useful benchmark: at the exact 2022 rate of 172 goals in 64 matches, a 104-match tournament would produce 279.5 goals. The actual total was 28.5 above that benchmark. This is arithmetic, not a causal estimate, but it shows why “there were more games” is an incomplete answer.
Expansion from 32 to 48 teams also changed who played whom. Dividing by matches removes the effect of having more fixtures; it does not remove differences in their competitiveness. A schedule containing more mismatches can still have a higher goals-per-match average. Germany’s 7–1 win over Curaçao was one conspicuous example, reported by beIN SPORTS during the tournament. One rout, however, cannot explain the tournament on its own.
The attacking gap was about creating chances
Jamon Moore’s American Soccer Analysis study, using charts from before the final weekend, offers a more specific tactical explanation.
In its classification, the top-performing quarter of teams increased the share of goals in the Progressive Pass category from 33% in 2018 to 45% in 2026. The category concerns deliberate final passing combinations, with examples including vertical passes through the lines and horizontal passes into the box. It should not be confused with a provider’s count of all progressive passes across a match.
The study also found that top teams created roughly twice as many cutback situations per game as bottom teams. A cutback is a pass back from near the goal line toward a teammate in a shooting position. Imagine a winger reaching the byline and finding an unmarked attacker centrally: the important feature is not possession volume, but the position in which the receiver can shoot.
Moore’s broader finding was that weaker teams were building attacks into dangerous areas more often than in 2018, but still struggled with the final combination. They relied more on loose balls, failed clearances and other opportunities without a deliberate final pass. That supports a plausible explanation for the higher scoring environment: more teams were attempting to attack, while the best teams remained much better at turning attacks into good chances.
There are important limits. The tiers are based on tournament results, expansion changes which teams fall into each quarter, and the study uses multiple data providers whose event classifications can differ. A larger share of goals in one category is not itself proof of more chances overall. These patterns help explain how attacks worked; they do not establish how many additional goals expansion or tactical change caused.
Long-range goals added another route
FIFA recorded 43 goals from outside the penalty area, including seven direct free kicks and 36 from open play. That is about 14% of the 308 goals, compared with the 8% outside-the-box share FIFA reports for 2022. FIFA’s scoring analysis identifies distance shooting as a way teams challenged compact defences.
That does not mean long shots became the best attacking choice. More goals from distance could reflect more attempts, better shooting opportunities or unusually successful finishing. Goals alone cannot separate those possibilities.
The same distinction applies to the tournament overall: a higher scoring rate is not automatically evidence of better finishing or worse defending. To distinguish more chances from better chances and conversion, you need comparable shot and expected-goals data—not just the final scores.